League Standings for Premier, Div 1, Div 2, Div 3
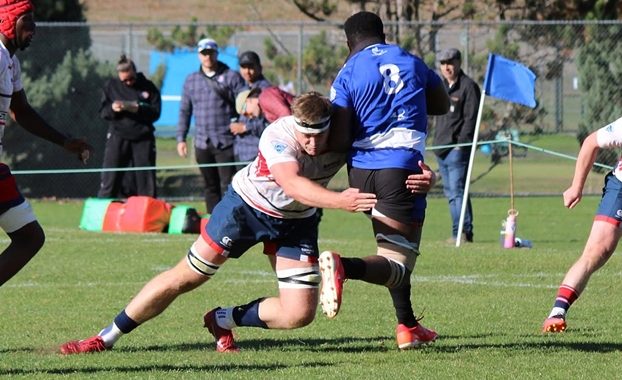
Special thanks to Peter Muirhead for putting these standings together, the PlayHQ system that the BCRU uses is still not updating properly. The PlayHQ system can be accessed here for match results, however tries and try bonus points are not working consistently on their system at the present time. The tables below are ordered by Points per Game rather than total points. Photo by BCRN Westshore v Ravens, more match photos on BCRN FB page.
| Men Premier | |||||||||||
| Win | Draw | Loss | Bonus pts |
Points | Points per game |
For | Against | Score Difference |
Trys Scored |
Trys Conceded |
|
| JBAA | 3 | – | – | 3 | 15 | 5.00 | 159 | 62 | 97 | 41 | 7 |
| Capilano | 4 | – | 1 | 4 | 20 | 4.00 | 198 | 146 | 52 | 28 | 31 |
| Ravens | 3 | – | 1 | 4 | 16 | 4.00 | 188 | 99 | 89 | 29 | 15 |
| Westshore | 3 | – | 1 | 3 | 15 | 3.75 | 200 | 125 | 75 | 32 | 16 |
| UBC | 3 | – | 1 | 2 | 14 | 3.50 | 135 | 87 | 48 | 20 | 13 |
| Meraloma | 3 | – | 2 | 4 | 16 | 3.20 | 172 | 180 | (8) | 28 | 29 |
| UVic | 1 | – | 2 | 2 | 6 | 2.00 | 91 | 94 | (3) | 11 | 14 |
| Burnaby | 1 | – | 4 | 4 | 8 | 1.60 | 123 | 153 | (30) | 16 | 25 |
| CW | 1 | – | 3 | 2 | 6 | 1.50 | 84 | 197 | (113) | 13 | 31 |
| Bayside | 1 | – | 4 | 2 | 6 | 1.20 | 102 | 244 | (142) | 16 | 44 |
| Rowers | – | – | 4 | 3 | 3 | 0.75 | 99 | 164 | (65) | 15 | 24 |
| Men Division 1 | |||||||||||
| Men Division 1 – Island | |||||||||||
| Win | Draw | Loss | Bonus pts |
Points | Points per game |
For | Against | Score Difference |
Trys Scored |
Trys Conceded |
|
| UVic | 4 | – | – | 4 | 20 | 5.00 | 159 | 58 | 101 | 25 | 8 |
| Westshore | 3 | – | – | 2 | 14 | 4.67 | 138 | 12 | 126 | 15 | 2 |
| Nanaimo | 3 | – | 1 | 3 | 15 | 3.75 | 130 | 117 | 13 | 20 | 17 |
| JBAA | 2 | – | 2 | 6 | 14 | 3.50 | 158 | 112 | 46 | 27 | 13 |
| CW | – | – | 3 | 1 | 1 | 0.33 | 48 | 115 | (67) | 4 | 17 |
| Cowichan | 1 | – | 3 | 1 | 1 | 0.25 | 105 | 124 | (19) | 16 | 15 |
| Comox | – | – | 4 | – | – | – | 65 | 178 | (113) | 9 | 25 |
| Port Alberni | – | – | 3 | – | – | – | 29 | 213 | (184) | 4 | 35 |
| Men Division 1 – Mainland | |||||||||||
| Win | Draw | Loss | Bonus pts |
Points | Points per game |
For | Against | Score Difference |
Trys Scored |
Trys Conceded |
|
| Kelowna | 5 | – | – | 4 | 24 | 4.80 | 240 | 97 | 143 | 35 | 15 |
| Capilano | 3 | 1 | – | 3 | 17 | 4.25 | 112 | 75 | 37 | 16 | 11 |
| Langley | 3 | – | 1 | 3 | 15 | 3.75 | 221 | 76 | 145 | 23 | 12 |
| UBC | 3 | – | 1 | 3 | 15 | 3.75 | 99 | 103 | (4) | 15 | 16 |
| Axemen | 3 | 1 | 1 | 3 | 15 | 3.00 | 147 | 62 | 85 | 20 | 9 |
| Rowers | 2 | – | 2 | 3 | 11 | 2.75 | 97 | 170 | (73) | 15 | 11 |
| Meraloma | 2 | – | 3 | 3 | 11 | 2.20 | 107 | 171 | (64) | 14 | 23 |
| Burnaby | 1 | – | 3 | 3 | 7 | 1.75 | 113 | 121 | (8) | 16 | 19 |
| Bayside | – | – | 3 | 4 | 4 | 1.33 | 64 | 145 | (81) | 9 | 23 |
| Abbotsford | – | – | 3 | 2 | 2 | 0.67 | 83 | 144 | (61) | 14 | 21 |
| Ravens | – | – | 2 | 1 | 1 | 0.50 | 43 | 65 | (22) | 6 | 11 |
| Men Division 2 | |||||||||||
| Win | Draw | Loss | Bonus pts |
Points | Points per game |
For | Against | Score Difference |
Trys Scored |
Trys Conceded |
|
| Kats | 4 | – | – | 4 | 20 | 5.00 | 130 | 43 | 87 | 22 | 7 |
| Kamloops | 3 | – | – | 2 | 14 | 4.67 | 158 | 28 | 130 | 21 | 4 |
| Bruins | 3 | – | 1 | 2 | 14 | 3.50 | 88 | 46 | 42 | 14 | 9 |
| Brit Lions | 2 | – | 2 | 2 | 10 | 2.50 | 131 | 137 | (6) | 25 | 18 |
| United | 2 | – | 2 | 2 | 10 | 2.50 | 72 | 84 | (12) | 8 | 24 |
| Surrey | 1 | – | 2 | 1 | 5 | 1.67 | 114 | 92 | 22 | 18 | 14 |
| Richmond | 1 | – | 2 | 1 | 5 | 1.67 | 65 | 65 | – | 12 | 7 |
| Chilliwack | 1 | – | 3 | 1 | 5 | 1.25 | 72 | 162 | (90) | 9 | 18 |
| Scribes | 1 | – | 3 | – | 4 | 1.00 | 24 | 144 | (120) | 3 | 19 |
| SFU | – | – | 3 | 3 | 3 | 1.00 | 71 | 124 | (53) | 10 | 22 |
| Men Division 3 | |||||||||||
| Win | Draw | Loss | Bonus pts |
Points | Points per game |
For | Against | Score Difference |
Trys Scored |
Trys Conceded |
|
| United | 3 | – | – | 3 | 15 | 5.00 | 127 | 57 | 70 | 20 | 4 |
| Abbotsford | 3 | – | – | 3 | 15 | 5.00 | 123 | 83 | 40 | 20 | 13 |
| Meraloma | 4 | – | – | 3 | 19 | 4.75 | 153 | 52 | 101 | 26 | 6 |
| Axemen | 2 | – | 1 | 3 | 11 | 3.67 | 98 | 50 | 48 | 16 | 8 |
| Bayside | 1 | – | 1 | 1 | 5 | 2.50 | 23 | 66 | (43) | 4 | 10 |
| Langley | 1 | – | 2 | 2 | 6 | 2.00 | 69 | 114 | (45) | 8 | 19 |
| Kelowna | 1 | – | 4 | 5 | 9 | 1.80 | 134 | 144 | (10) | 22 | 24 |
| Burnaby | 1 | – | 2 | 1 | 5 | 1.67 | 46 | 64 | (18) | 5 | 9 |
| Capilano2 | 1 | – | 2 | – | 4 | 1.33 | 48 | 57 | (9) | 4 | 10 |
| Capilano1 | – | – | 3 | – | – | – | 27 | 88 | (61) | 2 | 15 |
| Rogues | – | – | 2 | – | – | – | 12 | 85 | (73) | 2 | 11 |
| Women Premier | |||||||||||
| Win | Draw | Loss | Bonus pts |
Points | Points per game |
For | Against | Score Difference |
Trys Scored |
Trys Conceded |
|
| Westshore | 3 | – | – | 3 | 15 | 5.00 | 150 | 39 | 111 | 27 | 7 |
| Meraloma | 2 | – | 1 | 2 | 10 | 3.33 | 73 | 79 | (6) | 13 | 14 |
| Burnaby | 1 | – | 1 | 2 | 6 | 3.00 | 69 | 37 | 32 | 8 | 6 |
| Thunderbird | 1 | – | 1 | 1 | 5 | 2.50 | 71 | 129 | (58) | 11 | 23 |
| CW | 1 | – | 2 | 1 | 5 | 1.67 | 52 | 73 | (21) | 10 | 13 |
| Ravens | – | – | 3 | 1 | 1 | 0.33 | 41 | 99 | (58) | 7 | 13 |
| Seattle | – | – | – | – | – | – | – | – | – | – | – |
| Women Division 1 | |||||||||||
| Win | Draw | Loss | Bonus pts |
Points | Points per game |
For | Against | Score Difference |
Trys Scored |
Trys Conceded |
|
| Comox | 2 | – | – | 2 | 10 | 5.00 | 166 | 7 | 159 | 26 | 1 |
| Kamloops | 2 | – | – | 2 | 10 | 5.00 | 146 | 32 | 114 | 24 | 6 |
| Capilano | 2 | – | – | 2 | 10 | 5.00 | 123 | 32 | 91 | 19 | 6 |
| Abbotsford | 2 | – | – | 2 | 10 | 5.00 | 78 | 12 | 66 | 14 | 3 |
| JBAA | 2 | – | 1 | 3 | 11 | 3.67 | 136 | 38 | 98 | 24 | 6 |
| Kelowna | 2 | – | 1 | 1 | 9 | 3.00 | 46 | 50 | (4) | 4 | 8 |
| Bayside | 1 | – | 2 | 3 | 7 | 2.33 | 86 | 114 | (28) | 14 | 18 |
| CW | 1 | – | 1 | – | 4 | 2.00 | 20 | 51 | (31) | – | 9 |
| Thunderbird | – | – | 2 | 1 | 1 | 0.50 | 39 | 130 | (91) | 7 | 22 |
| Meraloma | – | – | 2 | – | – | – | – | 40 | (40) | – | – |
| United | – | – | 2 | – | – | – | 22 | 134 | (112) | 5 | 22 |
| Nanaimo | – | – | 3 | – | – | – | 7 | 229 | (222) | 1 | 37 |
| Women Division 2 | |||||||||||
| Win | Draw | Loss | Bonus pts |
Points | Points per game |
For | Against | Score Difference |
Trys Scored |
Trys Conceded |
|
| Langley | 3 | – | – | 3 | 15 | 5.00 | 207 | – | 207 | 33 | – |
| Chilliwack | 3 | – | – | 3 | 15 | 5.00 | 86 | 56 | 30 | 15 | 7 |
| Westshore | 2 | – | – | 1 | 9 | 4.50 | 86 | 5 | 81 | 12 | – |
| Burnaby | 1 | – | – | – | 4 | 4.00 | 48 | 7 | 41 | – | – |
| Bruins | 1 | – | 1 | 1 | 5 | 2.50 | 36 | 54 | (18) | 5 | 10 |
| RichLions | 1 | – | 2 | 2 | 6 | 2.00 | 67 | 59 | 8 | 10 | 4 |
| SFU | – | – | 1 | – | – | – | 19 | 32 | (13) | 3 | 6 |
| Rowers | – | – | 2 | – | – | – | 12 | 61 | (49) | 2 | 12 |
| Cowichan | – | – | 2 | – | – | – | 12 | 114 | (102) | – | 12 |
| Scribes | – | – | 3 | – | – | – | 12 | 197 | (185) | 2 | 31 |